
In the past few years, with the rise in analytics and teams hyper-focus on draft performance, the National Hockey League among others have been studying the draft; the players and the leagues and all patterns and correlations between size, position, stats, etc.
We have put our analysts on the task of breaking down the NHL Draft in a three-pronged approach.
- An analysis of the NHL Draft Results
- Breaking down the Draft Market
- Breaking down Position/League/Size Correlations & Bias
-
Analysis of the NHL Draft Results
There have been countless studies in the past 10 years evaluating NHL Draft “success” all with a different lens and focus. Some see NHL success as playing in at least one NHL game, others look at it by recording 25 or more points, some look at it as playing in 100 or 200 games. Regardless of the “success” metric used; we analyzed the NHL Draft results over 20-year period to get an idea of how well the NHL Draft process worked in evaluating and projecting talent.
Arguably the most noticeable data we found has been the increase in undrafted prospects in the league. Again, depending on how you measure an “active” we simply picked a date in November and took all the active rosters on that day to count how many players were undrafted in the NHL. Our number was 125 which accounts for 20% of the NHL population. That is a significant stat that differentiates hockey from other professional sports. One in every five players in an NHL locker room was never drafted.
The other statistically significant and consistent data over the past 20 years is the correlation between draft round and future success in the NHL. Sportsnet did a nice job analyzing drafts based on 100 games or 200 games shown below:
Chart 1-01
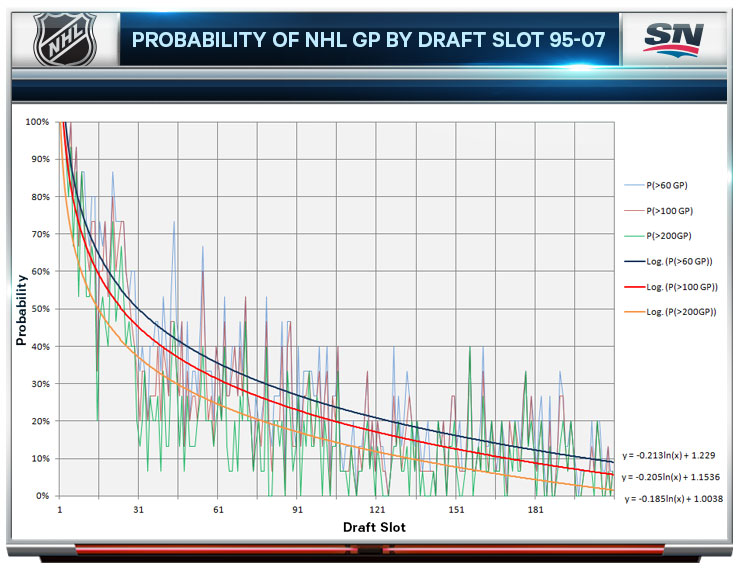
This chart clearly shows the importance of draft position and the low percentage of drafted players who make it to 200 games in the NHL. The 25th overall pick has only a 40% of playing 200 games in a career and just over 50% chance of playing 100 games.
Chart 1-02
NHL Draft 1995-2005
| Pick | Appeared In NHL | Played 100+ Games In NHL |
| Top-5 | 100% | 96.3% |
| 6-10 | 100% | 78.1% |
| Rest of First Round | 88.6% | 63.0% |
| Second Round | 65.7% | 31.1% |
| Third Round | 50.7% | 27.9% |
| Fourth Round | 36.0% | 18.7% |
| Fifth Round | 29.9% | 14.2% |
| Sixth Round | 30.0% | 14.3% |
| Seventh Through Ninth Rounds | 27.1% | 11.6% |
* Source: Adam Getz
Draft position importance is not just about how well first round picks compare to second round picks but also the variations. In chart 1-02 we see two different metrics, appearing in the NHL and playing 100 or more games. In the 100+ games example, it is clear to see that the majority of first round picks play at least 100 games in the NHL. After that, the percentages drop dramatically and less than 1/3 of second round picks will play 100+ NHL games. However, what is most interesting here is that there is more variability from a first round picks success rate to a second-round pick (39%) then from a second-round pick to a seventh-round pick (19.5%). This is consistent with the data in Chart 1-01 showing that after the first two rounds, the success rate drops and there are small differences between the later rounds. Therefore, a fourth-round pick does have a slightly better chance of making it to the NHL than a sixth-round pick but its very small and relatively insignificant.
So, what does this tell us?
At first the data appears to be quite surprising but after analyzing 5 years of NHL trades, it isn’t. The NHL clubs trade away draft picks in rounds 3-7 fairly loosely relative to other sports and get little value in return. The experts on the NHL clubs know this data better than anyone and today there are websites who can use historical data over the past 20 years and assign projected value for every pick in every round.
While there are other factors at play here including collective bargaining, salary cap constraints and the pure available positions open each year in the NHL through retirement, injury or players being sent down to the minors. However, the historical draft results show that the low NHL Draft success rates are systemic. It’s not a few bad scouts, it’s not a few misguided GM’s, the entire league follows nearly the same exact trend. The higher draft position, the greater chance that player has to making the NHL which shows NHL teams have done a consistent job in evaluating and scouting the draft base as a whole. If you saw third round picks outperforming second round picks and fourth round picks outperforming first round picks then that would show scouting staffs were inefficient and give way to thoughts that there is no science behind draft picks just guesses.
For our purposes of this study we are looking at what goes into the NHL Draft. Why is 20% of the league undrafted and why does only 1/3 of the second-round picks (the best 31-61 players in the world) make it to 100+ games in the NHL? If we understand that the draft is systemic then what are the systemic factors that go into a player’s draft?
-
The Draft Market
To understand the draft, you have to understand the key players involved. The biggest players are obviously the NHL teams scouting departments who have the final say in how the process goes. However, those key players impacted by other factors. These factors could include the players personality, biases those departments have for particular leagues, the agent the player has, etc. In talking with several Directors of Amateur Scouting throughout the NHL, it is clear that the biggest market setter is NHL Central Scouting.
A breakdown of the key players:
NHL Amateur Scouts:
Each NHL has its own scouting staff; the majority of those scouts are dedicated to evaluating players for the NHL Draft with a smaller number of scouts focused on NHL/AHL pipelines, trades and free agents, etc. While each organization has its own unique way of covering all the amateur prospects in North America and Europe; the most popular strategy is to hire regional scouts to cover the major hockey markets (Ontario, Minnesota, British Columbia, etc) or to split it up by different leagues (OHL, WHL, QMJHL, USHL, BCHL, Minnesota HS, etc.). The regional scouts compile scouting reports throughout the season with the aid of cross-over or national scouts who compare the Minnesota High School player to the USHL player to the New England prep player. Then the Director of Amateur scouting typically has multiple views as well of each prospect so that they can compare a US prospect playing in NCAA to a CHL prospect playing in Canada to a European prospect playing in Sweden.
These regional, national and director level scouts are among the most experienced and qualified hockey minds in the game and yet after a great deal of views with experienced and talented eyes in a multi-step process the number of players in the draft who “make it” are slim.
NHL Central Scouting:
NHL is an independent scouting service funded by the NHL which sets the market for the amateur draft prospects. They are comprised of a group of qualified and experienced scouts who are hired by the NHL to develop draft lists of the top NHL prospects throughout the world. Their lists carry major weight because they attempt to identify the market value of each player through a midterm and final ranking list. For example, if Central Scouting has a player listed as first round pick and the New York Islanders want that player but only have a second-round selection then they know he may go earlier because his market value is that of a first-round pick. They may have to trade up to get him. There are other scouting agencies and there are other factors in knowing if a player is highly sought out or not, but Central Scouting has the biggest platform.
***Side Story: In the old days before Central Scouting and before sophisticated draft practices NHL scouts would pull a player aside and ask who else the player was talking to in an attempt to gauge market value. One veteran scout even told us how he would tell the players not to tell anyone that they’d met to try and keep them under the radar and also to see if the kid could be trusted.
NHL Agents:
In regards to agents impact on the draft it’s something to note, but important not to overstate. An agent can’t get a player drafted but they can point regional scouts in the right direction and the major agencies have built-in relationships with certain GM’s and scouting directors. The major agencies have an advantage because the NHL teams know that these agents work with current pros, know what it takes to make it and wouldn’t take on these clients unless they felt the player had pro upside. For example, it’d be hard not to listen to a strong recommendation from Bobby Orr or Pat Brisson who represent players like McDavid and Crosby to name a few.
League Affiliations:
What league a player is playing in during their draft year matters, but it is hard to gauge and it’s much more of a team by team basis then a systemic factor. For example, in the 2017 NHL Draft the New York Rangers had 7 draft picks and they selected 5 Europeans while San Jose drafted 4 NCAA bound prospects out of their 6 picks and Calgary selected CHL players with 4 of their 5 picks.
Our Study:
Our task is breaking down the factors that go into the NHL Draft and uncover any patterns in the draft selection process. With the exhaustive research on percentage of players who make it out of the draft we wanted to take a different vantage point and figure out if the Draft Market was efficient in serving its role.
For our extensive purposes we decided to use North American Skaters list and select the two most relevant years of draft data which would be 2016 and 2017. We selected North American Skaters because that list accounts for the highest percentage of players drafted in the NHL from 65-75% over the past 10 years. Every player listed on central scouting or drafted in the NHL in 2016 and 2017 are listed at the bottom of this report in Chart 2-01 and 2-02.
The columns Mid-Final, Final-Draft and Mid-Draft are variability measurements. Mid-Final measures the difference between the Mid Term Rankings and the Final Rankings by Central Scouting. Chart 2-03 and 2-04 shows the difference between the Mid-Term and Final Rankings. The numbers below zero represent players whose rankings fell from midterm to final while positive numbers represent players who have improved. For the top 50 ranked players there is little variation between the midterm and final rankings but as the rankings go beyond 50 the variation increases. The chart only shows players who were ranked in both an excludes players who were only ranked in midterm or final.
Midterm Ranking – Final Ranking
Chart 2-03
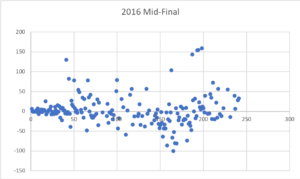
Chart 2-04
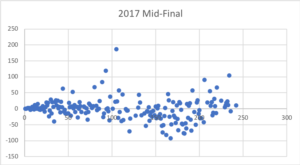
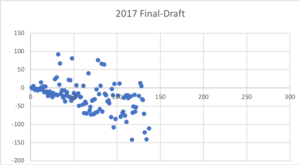
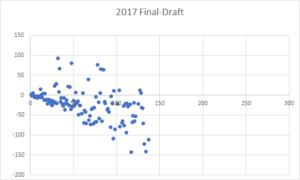
Chart 2-05 and 2-06 shows the variation between the Final Central Scouting Rankings and the NHL Draft position. In the first two rounds (60 picks) there is little difference in the rankings. After the second round the variations increase and they have a downward trend showing that players tended to fall from the final ranking to the draft position.
Final Ranking – NHL Draft Position
Chart 2-05

Chart 2-06
After seeing the data in final rankings vs. NHL Draft position, we evaluated if the trends were the same between Midterm rankings and Draft Rankings. The general idea is similar; the variation increases after the first 2 rounds of draft picks and there is a downward trend showing that midterm prospects are ranked higher in January then on draft day.
Midterm Rankings – Draft Position
Chart 2-07
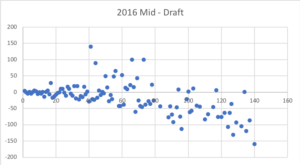
Chart 2-08
This is not surprising as historical NHL Draft data shows that less than 10% of players drafted 3rd round and beyond will have a career in the NHL so we would expect to see higher variations after the top 60 picks.
It is important to note that these charts are only between players who were listed on Central Scouting and drafted and doesn’t account for players who were ranked by central scouting and not drafted. So, we included those figures here as well to give a more complete vantage point.
Chart 2-09
NHL Draft Picks Unranked in Central Scouting
| Midterm | Final | Neither | |
| 2016 | 33 | 23 | 21 |
| 2017 | 30 | 18 | 17 |
Chart 2-10
CS Ranked Players Not Drafted
| Midterm | Final | Euro+Goalie | Mid Net | Final Net | ||
| 2016 | 101 | 91 | 68 | 33 | 23 | |
| 2017 | 110 | 98 | 79 | 31 | 19 | |
What these two charts (2-09 & 2-10) show is that in 2016 and 2017 there were roughly the same number of players in North America drafted without ever being ranked by central scouting and that the number of “misses” decreases from Midterm to Final. The 101 (2016) and 110 (2017) midterm rankings seem like major numbers who were not drafted, but it is important to understand they rank the total number of draft picks so the real number of ranked players undrafted is North American Skaters minus Europeans and Goaltenders. Therefore, the midterm and final net results are the number of North American skaters who were ranked and not drafted accounting for Europeans and Goaltenders.
What does this data tell us?
Central Scouting sets the market place by identifying the prospects and assigning those players a value (rank). We see that the value changes over the course of the season from midterm to final rankings. The accuracy from projected draft position versus actual is far more precise in the first two rounds then the next five. In speaking of percentages, we see that 7-10% of North American skaters are drafted from outside of the Central Scouting list and that 13-15% of drafted North American skaters were listed in the final ranking but not the midterm. We also see that 48-50% of North American skaters ranked in the midterm ranking go undrafted and even after subtracting Europeans and Goaltenders there is still 14-15% of net undrafted prospects.
There are things to learn from all angles here. Players should understand that Central Scouting is not precise science, especially after the second round. They should also note that players change from midterm to final so at no point is their draft stock set in stone as is often said “don’t get happy and don’t get discouraged.”
For NHL teams they should see that while NHL Central Scouting sets the market, it is ultimately up to the NHL teams to decide who they believe are the best prospects. There are players drafted from off the list and there are players the list saw as top 50 picks who didn’t go in the top 100.
Overall, the takeaway is that the NHL Central Scouting is not a science and its not precise after the second round which is consistent with the NHL Draft results over time. What that means is that the market setter
**Another Study Takeaway: Is it better to be left off Central Scouting midterm rankings? Sometimes being on the list can lead to higher scrutiny and teams may have more viewings then a player who is not on the list. Sometimes more viewings improve a player’s stock but it can also do the opposite. There is a theory in scouting circles that the more times you watch a mid-level player the less you like them.
-
League / Size / Positional Correlation & Bias
Bias is a scouts most fierce enemy and something a diligent scout needs to fight constantly. We have done analysis in the past comparing CHL, NCAA, Junior and High School stats compared to NHL production but the reality is that those have very loose correlations. It’s also dangerous to make that kind of cause-effect assumptions because less than 10 players on average will play in the NHL the year after their draft and the average NHL rookie is over 22 years old so those players stats in their draft year will change, sometimes dramatically before they play in the NHL.
With that being said, we picked three important variables in analyzing NHL Drafts. We continue to use the 2016 and 2017 Central Scouting and NHL Draft data used above but focusing here on size (height), league (in draft year) and position (minus goalies).
League Data
Charts 3-01 and 3-02 show the breakdown of draft picks by league. The total number of players drafted from each league is of interest and an important determination of what leagues NHL scouts value; however, the number of players listed in Central Scouting vs. the number of players in that league drafted will help determine any biases.
NHL Central Scouting – League Breakdown
Chart 3-01
| 2016 | ||||||||||||||||||
| League | All Players | Draft Picks | Off List | % Drafted | % Off List | % of CS | ||||||||||||
| OHL | 69 | 44 | 3 | 63.8% | 4.3% | 27.5% | ||||||||||||
| WHL | 55 | 32 | 4 | 58.2% | 7.3% | 21.3% | ||||||||||||
| QMJHL | 34 | 13 | 1 | 38.2% | 2.9% | 13.8% | ||||||||||||
| BCHL | 6 | 3 | 50.0% | 0.0% | 2.5% | |||||||||||||
| US High | 25 | 6 | 1 | 24.0% | 4.0% | 10.0% | ||||||||||||
| USHL | 25 | 14 | 4 | 58.5% | 9.8% | 15.4% | ||||||||||||
| CAN HS | 1 | 0 | 0.0% | 0.0% | 0.4% | |||||||||||||
| OJHL | 4 | 2 | 1 | 50.0% | 25.0% | 1.3% | ||||||||||||
| NAHL | 6 | 3 | 2 | 50.0% | 33.3% | 1.7% | ||||||||||||
| CCHL | 2 | 1 | 50.0% | 0.0% | 0.8% | |||||||||||||
| NCAA | 16 | 13 | 5 | 81.3% | 31.3% | 4.6% | ||||||||||||
| AJHL | 1 | 0 | 0.0% | 0.0% | 0.4% | |||||||||||||
| MJHL | 1 | 1 | 100.0% | 0.0% | 0.4% | |||||||||||||
| NTDP | 16 | 10 | 62.5% | 0.0% | 6.7% | |||||||||||||
|
|
Chart 3-02 | |||||||||||||||||
| 2017 | ||||||||||||||||||
| League | All Players | Draft Picks | Off List | % Drafted | % Off List | % of CS | ||||||||||||
| OHL | 71 | 40 | 3 | 56.3% | 4.2% | 27.3% | ||||||||||||
| WHL | 59 | 29 | 2 | 49.2% | 3.4% | 22.9% | ||||||||||||
| QMJHL | 34 | 14 | 41.2% | 0.0% | 13.7% | |||||||||||||
| BCHL | 4 | 1 | 25.0% | 0.0% | 1.6% | |||||||||||||
| US High | 22 | 13 | 2 | 59.1% | 9.1% | 8.0% | ||||||||||||
| USHL | 32 | 17 | 6 | 53.1% | 18.8% | 10.4% | ||||||||||||
| CAN HS | 2 | 2 | 100.0% | 0.0% | 0.8% | |||||||||||||
| OJHL | 4 | 2 | 50.0% | 0.0% | 1.6% | |||||||||||||
| NAHL | 2 | 1 | 1 | 50.0% | 50.0% | 0.4% | ||||||||||||
| CCHL | 2 | 1 | 50.0% | 0.0% | 0.8% | |||||||||||||
| NCAA | 14 | 6 | 2 | 42.9% | 14.3% | 4.8% | ||||||||||||
| AJHL | 4 | 3 | 1 | 75.0% | 25.0% | 1.2% | ||||||||||||
| NCDC | 1 | 0.0% | 0.0% | 0.4% | ||||||||||||||
| NTDP | 14 | 9 | 64.3% | 0.0% | 5.6% | |||||||||||||
The OHL is typically known as the best producer of NHL talent in the world. So, if we look at the 2016 and 2017 data we see a lot of similarities. Both years OHL players represented 27% percent of the Central Scouting’s North American skater pool. In both years they had 4% or 3 skaters get drafted from outside of the Central Scouting’s list. In 2016 over 63.8% of the OHL players on Central’s list were drafted but in 2017 it fell slightly to 56.3%.
If we compare the OHL to the QMJHL and USHL we’ll see some difference. The QMJHL represents about 13% of Central’s North American skaters but have a lower conversion rate to draft picks with 38-41% being drafted. The USHL on the other hand showed a smaller fraction of Central Scouting’s list representing 10-15% of the player pool but the conversion rates were much higher at 53-58%. The NCAA and USHL appear to get less respect then the CHL leagues given that in 2017 the USHL had 18% of its pool come from outside of Central’s list and NCAA had 14%. In 2016 the numbers were 10% and 31% respectively. Compare that to the CHL and we see percentages of 0%, 2%, 3%, 4%, 4% and 7%. Therein reflects a bias both on drafts and on Central Scouting in undervaluing the NCAA/USHL route.
The US National Program had an impressive conversion rate at over 60% and the majority of draft eligible players on the team were listed on Central Scouting. However, there are not any “diamonds in the rough” as there wasn’t a single player in 2016 or 2017 who was drafted from NTDP who wasn’t listed on Central Scouting. What this shows is that some players and some leagues get more draft attention then others which makes sense. Central Scouting will see US NTDP U18’s a lot over the course of the season where they may just see Chilliwack (BCHL) a handful of times.
Size Data
Chart 3-03 breaks down the players drafted and listed on the 2017 Central Scouting at different heights from below 5’8 to 6’5” and above. It not only analyzes the total number of players but also looks at what round those players were selected. The data represents a bell curve with the majority of players falling in the middle heights of 5’11” to 6’2” as shown in Chart 3-04.
NHL Central Scouting Size Breakdown
Chart 3-03
| > 5’8″ | 5’8″ | 5’9″ | 5’10” | 5’11” | 6’0″ | 6’1″ | 6’2″ | 6’3″ | 6’4″ | 6’5″+ | ||
| Total CS | 5 | 9 | 9 | 22 | 41 | 53 | 26 | 57 | 16 | 15 | 11 | |
| % of CS | 1.9% | 3.4% | 3.4% | 8.3% | 15.5% | 20.1% | 9.8% | 21.6% | 6.1% | 5.7% | 4.2% | |
| 0-31 | 1 | 1 | 3 | 4 | 1 | 7 | 1 | 1 | 1 | |||
| 32-62 | 1 | 5 | 3 | 3 | 5 | 1 | 3 | |||||
| 63-93 | 1 | 4 | 3 | 1 | 7 | 2 | 2 | |||||
| 94-124 | 1 | 1 | 1 | 3 | 3 | 3 | 1 | 3 | 1 | |||
| 125-155 | 1 | 1 | 3 | 5 | 6 | 2 | ||||||
| 156-186 | 1 | 1 | 3 | 3 | 2 | 2 | 6 | 1 | 2 | |||
| 186+ | 3 | 1 | 2 | 4 | 3 | 1 | 2 | 3 | 1 | 1 | ||
| Undrafted | 4 | 3 | 7 | 12 | 18 | 32 | 10 | 23 | 8 | 8 | 1 | |
| % | 80.0% | 33.3% | 77.8% | 54.5% | 43.9% | 60.4% | 38.5% | 40.4% | 50.0% | 53.3% | 9.1% | |
Chart 3-04
| Size | # of Players | % |
| 5’10” and Below | 45 | 17.0% |
| 5’11” to 6’2” | 177 | 66.8% |
| 6’3” and Above | 42 | 15.9% |
What Chart 3-05 shows is the pattern that the taller the players, the lower their percentage of undrafted prospects is. This matches well with the old scout saying “if you are small you need to prove why you should be taken; if you’re tall, you need to prove why you shouldn’t be taken.”
Chart 3-05
| Size | Undrafted | % |
| 5’10” and Below | 26 | 57.8% |
| 5’11” to 6’2″ | 83 | 46.9% |
| 6’3″ and Above | 17 | 40.5% |
Charts 3-06 breaks down the different sizes and where they were drafted. Chart 3-07 breaks down the percentage of players at that size distributed by each round in the draft. The majority of smaller players (57.9%) were drafted in the sixth and seventh round whereas the middle-sized players had a fairly even distribution among the rounds. The tallest group of players were scattered.
Chart 3-06
| Draft | 5’10” & Under | 5’11” to 6’2″ | 6’3″ & Above |
| Round 1 | 2 | 15 | 3 |
| Round 2 | 1 | 16 | 1 |
| Round 3 | 1 | 15 | 4 |
| Round 4 | 3 | 10 | 4 |
| Round 5 | 1 | 15 | 2 |
| Round 6 | 5 | 13 | 3 |
| Round 7 | 6 | 10 | 5 |
Chart 3-07
| Draft | 5’10” & Under | 5’11”- 6’2″ | 6’3″ & Above |
| Round 1 | 10.5% | 16.0% | 13.6% |
| Round 2 | 5.3% | 17.0% | 4.5% |
| Round 3 | 5.3% | 16.0% | 18.2% |
| Round 4 | 15.8% | 10.6% | 18.2% |
| Round 5 | 5.3% | 16.0% | 9.1% |
| Round 6 | 26.3% | 13.8% | 13.6% |
| Round 7 | 31.6% | 10.6% | 22.7% |
What does this data tell us?
There is certainly a size bias in the draft which is slightly reflected in the number of players at different heights listed on central scouting but more importantly in the actual draft results. The smaller players have the highest percentage of undrafted players off central scouting. Also, the majority of players taken at 5’10” and below are taken in the sixth and seventh round (57.9%). Of the only 11 players who were 6’5” or taller listed on Central Scouting, only 1 of them was undrafted opposed to 5’9” skaters where 7 of the 9 players listed were undrafted.
Position
Charts 3-08 and 3-09 breakdown all the North American skaters that were listed on Central Scouting or Drafted and analyzes the draft patterns. The data clearly shows a bias towards centers where as centers should in a perfect system represent 33% of the forward group and they represent over 45%. Not only are there more centers being listed on Central Scouting but the conversion rates are the highest in both years at any position between 58-64%. Defense represents about 1/3 of total players listed which is in line with expectations (team rosters have a 2:3 ratio between defenders and forwards). However, defense is second only to centers in conversion rate showing that 54-56% of defenseman listed on central scouting are drafted. In regards to wings there were small variations between left and right wings showing more left wings listed and taken then right wings but the findings are not statistically significant. It does show however that wings are less valuable in the draft then both centers and defenseman as a whole.
NHL Central Scouting Position Breakdown
Chart 3-08
| 2016 | |||||
| Position | Drafted | Undrafted | Total | Draft % | Undrafted % |
| Center | 46 | 33 | 79 | 58.2% | 41.8% |
| Defense | 56 | 44 | 100 | 56.0% | 44.0% |
| Left Wing | 24 | 23 | 47 | 51.1% | 48.9% |
| Right Wing | 16 | 19 | 35 | 45.7% | 54.3% |
| Chart 3-09 | |||||
| 2017 | |||||
| Position | Drafted | Undrafted | Total | Draft % | Undrafted % |
| Center | 42 | 24 | 66 | 63.6% | 36.4% |
| Defense | 58 | 49 | 107 | 54.2% | 45.8% |
| Left Wing | 17 | 24 | 41 | 41.5% | 58.5% |
| Right Wing | 21 | 31 | 52 | 40.4% | 59.6% |
Combining Position and Size (2017)
Chart 3-10
| > 5’8″ | 5’8″ | 5’9″ | 5’10” | 5’11” | 6’0″ | 6’1″ | 6’2″ | 6’3″ | 6’4″ | 6’5″+ | Avg Size | |
| Center | 2 | 1 | 2 | 6 | 15 | 11 | 6 | 14 | 2 | 4 | 3 | 72.36 in |
| Defenseman | 0 | 2 | 1 | 2 | 16 | 22 | 11 | 28 | 11 | 8 | 6 | 73.22 in |
| Right Wing | 1 | 3 | 5 | 9 | 5 | 13 | 4 | 7 | 2 | 2 | 1 | 71.65 in |
| Left Wing | 2 | 3 | 1 | 5 | 5 | 7 | 5 | 8 | 1 | 1 | 3 | 72.02 in |
| Total | 5 | 9 | 9 | 22 | 41 | 53 | 26 | 57 | 16 | 15 | 13 | |
| CS % | 1.9% | 3.4% | 3.4% | 8.3% | 15.4% | 19.9% | 9.8% | 21.4% | 6.0% | 5.6% | 4.9% |
Combining both size and position shows that there is a slight correlation between size and position. Not only is the average height taller for defenders than forwards and that centers tend to be slightly taller then wings. The averages only tell one story, but the fact that there are only 5 defenders drafted or listed at 5’10” or shorter is significant considering there are 11 centers, 18 right wings and 11 left wings. On the opposite end there are 25 defenders listed or drafted at 6’3” or taller oppose to centers at 9, right wings at 5 and left wings at 5.
Conclusion
At Neutral Zone, we attempt to dig deeper into questions of the game; questions raised by players, parents, hockey professionals, draft analysts, scouts, coaches, etc. We have analyzed junior to college stats conversion rates to OHL Draft to NHL Draft carryover to freshman production based on what league they came from the year prior, etc.
This analysis was not only a look at the NHL Draft but the process and players behind it. We analyzed the market which is set by NHL Central Scouting and how accurate that is in predicting NHL Draft position. We attempted to discover some of the underlying factors that go into the draft and what makes the success rate beyond the first round so low?
The data showed that there are some built in bias by both NHL teams scouting departments as well as NHL Central Scouting; it shows a relatively low accuracy in predicting draft picks outside of the top 60 picks. Some of these biases include league bias, size bias and positional bias. We saw some evidence in each of those three factors that showed some leagues like the USHL are undervalued by Central Scouting, that players 5’10” and lower are undervalued by NHL teams and that certain positions produce more players in central scouting’s rankings and have varying levels of conversion rates of being drafted.
Overall, there is a strong correlation between NHL Central Scouting’s success in predicting NHL draft picks and the NHL Drafts success rate of producing career NHLers. It’s a sharp downward curve from first round to second round and then levels from rounds 3-7. Therefore, there are takeaways for both players and hockey professionals from this data.
Players:
How important is your Central Scouting Ranking? It depends on the ranking. A #1 rank is meaningful and sets a high market price on that player; however, a #100 rank has very little difference to #80 and #150. The probability of those three players to have an NHL career are all similar and are all pretty slim. Therefore, it is important for draft prospects who are NOT listed on Central Scouting to not get discouraged as nearly 10% of the draft will come from off that list and nearly 20% of the NHL is comprised of undrafted players!
The importance to a player should not be the ranking but the trend. In 2016 first round picks Matthew Tkachuk, Jakub Chychrun and Julien Gauthier saw their rankings fall in central scouting from midterm to final and that negative trend showed up in the draft. Tkachuk fell from #1 midterm to #2 final to #6 in the draft. Chychrun fell from #2 in midterm to #4 in the final to #16 in the draft. Gauthier had the biggest fall starting at #4 in the midterm to #12 in the final to #21 in the draft. Conversely, players who trended up from midterm to final saw that their final ranking was more accurate with their draft position. For example, Dennis Cholowski was ranked #48 midterm in 2016 and he moved up to #23 by the final and was drafted 20th overall. Pierre-Luc Dubois was the #7 midterm rank and rose to #1 by the final rankings and was the first North American skater taken. Some of the biggest movers are players like Wade Allison who was ranked #192 in midterm, climbed to #62 by the final and was drafted #52 overall. Dylan Gambrell is another example of a player ranked #149 in midterm, flew up the list to #67 by final and was drafted #60 overall.
There is data on both sides of the argument but the point remains the same.
Analogy: If you were told that surfing in certain area in Florida had an 88% chance of being bit by a Shark would you really care that a blue board decreases your probability by 8% oppose to a red board? Probably not because the end odds are still largely against you. The same can be said about the NHL Draft; your chances outside of the first round are against you to make a career playing in the NHL, so while being ranked 61st sounds a lot better then being ranked 151st, the data would show neither of those players are likely to have an NHL career. Therefore, focus on the trends and consistently getting better each year. With the average rookie age in the NHL being beyond 22 years old; a lot can happen over the course of 4 years; the players trending upward consistently over their amateur careers are the players with the greatest chance of making it to the NHL.
The data clearly dispels the myths out there in amateur hockey where players are pressured to play in certain leagues in their draft year. There are hundreds of players every year throughout North America rushing their development to prepare for their “draft year” and the effort is largely inefficient. Frankly, a player undrafted has a better chance of succeeding as a free agent than a late round pick because they have the option to sign with a team that is need of their skill set. However, parents and players will look at how many players are being drafted out of the OHL or the USHL and leave their high school teams or midget teams to give themselves the best chance of being drafted. Leaving Minnesota High School for example to play junior hockey in their draft year to move up from a late round pick to a middle round pick is a fruitless effort. Unless you are a top round pick, the probability of a third-round pick to a seventh-round pick of playing at least 200 games are all under 10% so making draft year decisions based on moving up a round or two in the draft are unwise and inefficient. Ignore the hype, play the game and focus on trending upwards over the course of the next 4 years because the NHL cares a lot more about how good you are at 22 then they do at 18!
Scouts & Hockey Professionals:
What is troubling about the NHL Draft results is not the fact that over 85% of the players in a given draft will not have an NHL career; but that the trend isn’t improving over time. The results on a year over year basis are relatively similar. If anything, there are more undrafted players in the league today then there were 20 years ago. So, in order to improve scouts, have to check their biases at the door and re-assess the market valuation of these players both in their own scouting rooms and by NHL Central Scouting itself. A good example of the size bias in the data would be a player like Alex Debrincat. He’s a 5’7” winger so he has both a size disadvantage and a positional disadvantage. However, he was the second leading goal scorer in the highest NHL producing league with 14 more goals then teammate Dylan Strome who was drafted a year earlier #3 overall. Strome was a 6’3” center listed at the top of Central Scouting. In fairness to NHL Central Scouting Debrincat was ranked #20 but the NHL passed on him 38 times until Chicago scooped him up with the 39th pick. Today, Debrincat is a legit Calder Trophy contender for NHL Rookie of the Year as a 20 year old.
In regards to league bias we see it more in these data sets with NHL Central Scouting then with the NHL Draft. For example, in 2017 the top 5 highest rated OHL picks were Gabriel Vilardi (#4), Owen Tippet (#7), Nick Suzuki (#10), Jason Robertson (#14) and Isaac Ratcliff (#15). However, come draft day Vilardi slipped from 4 to 11, Tippet 7 to 10, Suzuki 10 to 13, Robertson 14 to 39 and Ratcliff 15 to 35. A similar drop can be seen among USHL players in the first round has Shane Bowers was ranked #16 and fell to 28th overall on draft day and Eeli Tolvanen was ranked #8 and fell to 30th overall.
The key areas that scouts could use to identify diamond in the rough prospects would be to look at the leagues getting high number of players from off the list such as NCAA, USHL, WHL, OHL and NAHL. A league like the NAHL has too few players drafted to see a considerable pattern, but in both years they had skaters drafted from off Central’s list and had 50% conversion rate or higher of listed to drafted players. The NCAA has high conversion rates and high number of players being drafted off the list.
Overall, Central’s list needs to be taken for what it is; an independent ranking snapshoting where players stand at 18 years old relative to their peers. The NHL teams have somewhat of a different lens in that they are looking multiple years out where potential trumps current performance. However, given their different vantage point, their success rates are relatively the same with a highly efficient and accurate ranking system in the first round, considerably less in the second round and then all over the map throughout the rest of the draft.
With 20% of the NHL being undrafted and with roughly 10% of the drafted players coming from outside of NHL Central Scouting it is safe to say the draft process has room to grow. We think the first step would be to improve the accuracy of NHL Central Scouting in the bottom 5 rounds and second to eliminate size, league and positional biases as much as possible. Last year’s draft in the debate between Casey Mittelstadt versus Cody Glass as that Glass was playing in the WHL against better competition while Mittelstadt was playing Minnesota High School against a much weaker field. However, that theory is only half true. You also have to factor in that Mittelstadt wasn’t playing beside other NHL Draft talent while Cody Glass had NHL draft picks up and down the roster in Portland (WHL).
In interviewing several prominent Amateur Scouting Directors throughout the NHL the feedback we learned each team has their own unique process so it would be unfair to pain the whole industry with one brush; however, most all the directors we spoke to admitted that they spend the most amount of time on the top 40-60 players in the upcoming draft and watching games in the top development leagues (CHL, UHSL, NCAA , etc). The reasons varied from budget constraints to putting the highest priority on the players who have the highest chance of helping their teams.
While each scout answered the “where do you spend most of your time/” question differently, it showed there is a hyper-focus in the early round picks. It was also clear that many amateur scouts are put in a very difficult situation in contextual scouting without seeing the entire draft field. How can a New England scout have the context to rank a freshman in the NCAA against a second-year player in the OHL against a senior in Minnesota High School when they haven’t seen those players. The scouts claim they are not ranking players against others, they are simply evaluating the player based on his skill sets, assigning a grade and pushing that on to the scouting directors. However, grades and evaluations have to be contextual to be accurate regardless of the grading system. Therefore, if the scout watching Minnesota High School is giving the best skater in their region an “A” in skating ability where if that same player in the OHL would be seen as a “B” skater then that is an inefficient and inaccurate process.
What is the solution?
It would be inaccurate and unfair to act as though the draft results could be improved with one or two things because it’s a multi-variable process with many factors. However, there are two areas where both Central Scouting and NHL Scouting Staffs could explore to help improve their results.
- Seeing how NHL Central Scouting already does an accurate job identifying the top 60 North American skaters in the draft; there should be more attention and focus from the top down to mid-round and late round prospects.
- Organizationally scouts should try to cross-over as much as possible given budget restraints and travel. The current system has very few people at the top who are seeing everyone and the majority of their staff only seeing players within their league or region. This can lead to a lack of overall context throughout the staff and lead to inaccuracies and misguided selections.
If NHL Central Scouting or team’s internal scouting departments were a business the first thing they would do would be to find holes in their business plan and improve them. The holes in their business are in rounds 3-7.
Analogy: The analogy here might not be sharks and surf boards but real estate. In this example the scouting department will be a real-estate mogul who owns 7 properties. The first property is the golden goose and accounts for the majority of the rental income for that year. The second property is steady and earns a solid income, but nothing to boast about. Properties 3-7 were in rough shape and supplied very limited income. So the owners typically focus on the best two properties because they yield the highest return and let the properties 3-7 slip through the cracks because they supply only a small percentage of the overall rental revenue. This is an exaggerated example of the logic in the current draft landscape within the NHL. However, if you consider that Central Scouting is a Free Property Manager and does a good job managing high end properties but not as well with the lower end properties. It would then make more sense for the owner to not ignore the top two properties but allow the new property manager to do their job so it would free up more time to build up the other 5 properties to increase their respective rental values.
In the NHL world that would mean letting NHL Central Scouting weed out the top 60 players which it has shown a track record of doing accurately. The best players will always be the highest value for scouting directors, but it would make sense to make the other players a higher priority as there isn’t much variation between the top round players and there are major variations throughout the middle and end of the draft.
Chart 2-01
2016 Central Scouting Data
| Draft | CS Final | CS Mid | Mid-Final | Final – Draft | Mid – Draft | Player | Pos | Last Amateur Club | League |
| 3 | 1 | 7 | 6 | -2 | 4 | Dubois, Pierre-Luc | LW | Cape Breton | QMJHL |
| 5 | 5 | 5 | 0 | 0 | 0 | Juolevi, Olli | D | London | OHL |
| 6 | 2 | 1 | -1 | -4 | -5 | Tkachuk, Matthew | LW | London | OHL |
| 7 | 9 | 8 | -1 | 2 | 1 | Keller, Clayton | C | USNTDP | NTDP |
| 8 | 3 | 3 | 0 | -5 | -5 | Nylander, Alexander | LW | Mississauga | OHL |
| 9 | 8 | 10 | 2 | -1 | 1 | Sergachev, Mikhail | D | Windsor | OHL |
| 10 | 16 | 15 | -1 | 6 | 5 | Jost, Tyson | C | Penticton | BCHL |
| 11 | 7 | 14 | 7 | -4 | 3 | Brown, Logan | C | Windsor | OHL |
| 12 | 13 | 6 | -7 | 1 | -6 | McLeod, Michael | C | Mississauga | OHL |
| 13 | 15 | 13 | -2 | 2 | 0 | Bean, Jake | D | Calgary | WHL |
| 14 | 6 | 9 | 3 | -8 | -5 | McAvoy, Charles | D | Boston University | NCAA |
| 15 | 11 | 16 | 5 | -4 | 1 | Kunin, Luke | C | U Wisconsin | NCAA |
| 16 | 4 | 2 | -2 | -12 | -14 | Chychrun, Jakob | D | Sarnia | OHL |
| 17 | 18 | 18 | 0 | 1 | 1 | Fabbro, Dante | D | Penticton | BCHL |
| 18 | 19 | 23 | 4 | 1 | 5 | Stanley, Logan | D | Windsor | OHL |
| 19 | 10 | 12 | 2 | -9 | -7 | Bellows, Kieffer | LW | USNTDP | NTDP |
| 20 | 23 | 48 | 25 | 3 | 28 | Cholowski, Dennis | D | Chilliwack | BCHL |
| 21 | 12 | 4 | -8 | -9 | -17 | Gauthier, Julien | RW | Val-D’or | QMJHL |
| 24 | 14 | 11 | -3 | -10 | -13 | Jones, Max | LW | London | OHL |
| 25 | 17 | 17 | 0 | -8 | -8 | Tufte, Riley | LW | Blaine | USHS |
| 26 | 20 | 24 | 4 | -6 | -2 | Thompson, Tage | C | U Connecticut | NCAA |
| 27 | 22 | 27 | 5 | -5 | 0 | Howden, Brett | C | Moose Jaw | WHL |
| 28 | 26 | 38 | 12 | -2 | 10 | Johansen, Lucas | D | Kelowna | WHL |
| 29 | 47 | 39 | -8 | 18 | 10 | Frederic, Trent | C | USNTDP | NTDP |
| 30 | 30 | 29 | -1 | 0 | -1 | Steel, Sam | C | Regina | WHL |
| 32 | 24 | 21 | -3 | -8 | -11 | Benson, Tyler | LW | Vancouver | WHL |
| 34 | 57 | 50 | -7 | 23 | 16 | Peeke, Andrew | D | Green Bay | USHL |
| 35 | 34 | 45 | 11 | -1 | 10 | Kyrou, Jordan | C | Sarnia | OHL |
| 36 | 28 | 31 | 3 | -8 | -5 | Laberge, Pascal | C | Victoriaville | QMJHL |
| 37 | 31 | 26 | -5 | -6 | -11 | Hajek, Libor | D | Saskatoon | WHL |
| 38 | 42 | 57 | 15 | 4 | 19 | Mascherin, Adam | LW | Kitchener | OHL |
| 39 | 21 | 20 | -1 | -18 | -19 | Debrincat, Alexander | RW | Erie | OHL |
| 40 | 46 | 59 | 13 | 6 | 19 | Morrison, Cameron | LW | Youngstown | USHL |
| 41 | 35 | 19 | -16 | -6 | -22 | Bastian, Nathan | RW | Mississauga | OHL |
| 44 | 25 | 32 | 7 | -19 | -12 | Katchouk, Boris | LW | Sault Marie | OHL |
| 45 | 53 | 30 | -23 | 8 | -15 | Krys, Chad | D | USNTDP | NTDP |
| 46 | 54 | 63 | 9 | 8 | 17 | Smith, Givani | RW | Guelph | OHL |
| 47 | 38 | 40 | 2 | -9 | -7 | Girard, Samuel | D | Shawinigan | QMJHL |
| 49 | 49 | 51 | 2 | 0 | 2 | Lindgren, Ryan | D | USNTDP | NTDP |
| 51 | 27 | 22 | -5 | -24 | -29 | Clague, Kale | D | Brandon | WHL |
| 52 | 62 | 192 | 130 | 10 | 140 | Allison, Wade | RW | Tri-City | USHL |
| 56 | 41 | 35 | -6 | -15 | -21 | Dube, Dillon | C | Kelowna | WHL |
| 58 | 36 | 34 | -2 | -22 | -24 | Raddysh, Taylor | RW | Erie | OHL |
| 60 | 67 | 149 | 82 | 7 | 89 | Gambrell, Dylan | C | U Denver | NCAA |
| 63 | 52 | 46 | -6 | -11 | -17 | Niemelainen, Markus | D | Saginaw | OHL |
| 64 | 108 | 69 | -39 | 44 | 5 | Lockwood, William | RW | USNTDP | NTDP |
| 65 | 29 | 56 | 27 | -36 | -9 | Abramov, Vitaly | RW | Gatineau | QMJHL |
| 66 | 50 | 67 | 17 | -16 | 1 | Fox, Adam | D | USNTDP | NTDP |
| 67 | 51 | 64 | 13 | -16 | -3 | Filipe, Matt | LW | Cedar Rapids | USHL |
| 68 | 39 | 117 | 78 | -29 | 49 | Dineen, Cam | D | North Bay | OHL |
| 69 | 75 | 83 | 8 | 6 | 14 | Pu, Cliff | RW | London | OHL |
| 70 | 43 | 42 | -1 | -27 | -28 | Bitten, William | C | Flint | OHL |
| 71 | 60 | 62 | 2 | -11 | -9 | Anderson, Josh | D | Prince George | WHL |
| 73 | 56 | 52 | -4 | -17 | -21 | Anderson, Joseph | RW | USNTDP | NTDP |
| 74 | 68 | 122 | 54 | -6 | 48 | Elynuik, Hudson | C | Spokane | WHL |
| 76 | 93 | 141 | 48 | 17 | 65 | Pitlick, Rem | C | Muskegon | USHL |
| 77 | 100 | NR | 23 | Hall, Connor | D | Kitchener | OHL | ||
| 78 | 32 | 36 | 4 | -46 | -42 | Allard, Frederic | D | Chicoutimi | QMJHL |
| 79 | 40 | 37 | -3 | -39 | -42 | Green, Luke | D | Saint John | QMJHL |
| 80 | 98 | 132 | 34 | 18 | 52 | Gignac, Brandon | C | Shawinigan | QMJHL |
| 81 | 59 | 43 | -16 | -22 | -38 | Day, Sean | D | Mississauga | OHL |
| 82 | 64 | 95 | 31 | -18 | 13 | Twarynski, Carsen | LW | Calgary | WHL |
| 84 | 86 | 93 | 7 | 2 | 9 | Cairns, Matthew | D | Georgetown | OJHL |
| 85 | NR | NR | Josh Mahura | D | Red Deer | WHL | |||
| 86 | 156 | 108 | -48 | 70 | 22 | Fitzgerald, Casey | D | Boston College | NCAA |
| 87 | 109 | 187 | 78 | 22 | 100 | Pilon, Garrett | C | Kamloops | WHL |
| 92 | 72 | 107 | 35 | -20 | 15 | Brooks, Adam | C | Regina | WHL |
| 93 | 33 | 33 | 0 | -60 | -60 | Kopacka, Jack | LW | Sault Marie | OHL |
| 94 | 95 | 137 | 42 | 1 | 43 | Ang, Jonathan | C | Peterborough | OHL |
| 99 | 83 | 73 | -10 | -16 | -26 | Murray, Brett | LW | Carleton Place | CCHL |
| 100 | 74 | 58 | -16 | -26 | -42 | Mete, Victor | D | London | OHL |
| 101 | 71 | 55 | -16 | -30 | -46 | Middleton, Keaton | D | Saginaw | OHL |
| 103 | 185 | 203 | 18 | 82 | 100 | Burgess, Todd | RW | Fairbanks | NAHL |
| 104 | 77 | 66 | -11 | -27 | -38 | Zimmer, Max | LW | Chicago | USHL |
| 106 | 92 | NR | -14 | Duhaime, Brandon | RW | Tri-City | USHL | ||
| 109 | 87 | 81 | -6 | -22 | -28 | Bunnaman, Connor | C | Kitchener | OHL |
| 111 | 45 | 75 | 30 | -66 | -36 | Gregor, Noah | C | Moose Jaw | WHL |
| 113 | 171 | 136 | -35 | 58 | 23 | Noel, Nathan | C | Saint John | QMJHL |
| 114 | 66 | 88 | 22 | -48 | -26 | Stillman, Riley | D | Oshawa | OHL |
| 115 | 192 | NR | 77 | Dostie, Alex | C | Gatineau | QMJHL | ||
| 116 | NR | NR | Rhett Gardner | C | North Dakota | NCAA | |||
| 118 | 89 | NR | -29 | Colton, Ross | C | Cedar Rapids | USHL | ||
| 119 | 79 | 76 | -3 | -40 | -43 | Kaspick, Tanner | C | Brandon | WHL |
| 121 | NR | NR | Ryan Jones | D | Lincoln Stars | USHL | |||
| 122 | 203 | NR | 81 | Bobylev, Vladimir | RW | Victoria | WHL | ||
| 124 | 159 | NR | 35 | Staum, Casey | D | Hill-Murray | USHS | ||
| 125 | 209 | NR | 84 | Stevens, Nolan | C | Northeastern | NCAA | ||
| 126 | 61 | 49 | -12 | -65 | -77 | Mattson, Mitchell | C | Grand Rapids | USHS |
| 127 | 65 | 84 | 19 | -62 | -43 | Stallard, Jordan | C | Calgary | WHL |
| 130 | 90 | 61 | -29 | -40 | -69 | Budik, Vojtech | D | Prince Albert | WHL |
| 133 | 44 | 41 | -3 | -89 | -92 | Lajoie, Maxime | D | Swift Current | WHL |
| 136 | NR | NR | Cameron Clarke | D | Lone Star | NAHL | |||
| 137 | 96 | 90 | -6 | -41 | -47 | Sambrook, Jordan | D | Erie | OHL |
| 138 | 143 | 146 | 3 | 5 | 8 | Harper, Patrick | C | Avon Farms | USHS |
| 140 | 85 | 65 | -20 | -55 | -75 | Candella, Cole | D | Hamilton | OHL |
| 141 | 37 | 28 | -9 | -104 | -113 | Gettinger, Timothy | LW | Sault Marie | OHL |
| 142 | NR | NR | Mikey Eyssimont | C | St. Cloud State | NCAA | |||
| 144 | NR | NR | Conner Bleackley | C | Red Deer | WHL | |||
| 145 | 73 | 124 | 51 | -72 | -21 | Malenstyn, Beck | LW | Calgary | WHL |
| 146 | 69 | 148 | 79 | -77 | 2 | Caamano, Nicholas | RW | Flint | OHL |
| 148 | 130 | 87 | -43 | -18 | -61 | Paquette, Christopher | C | Niagara | OHL |
| 149 | 110 | 92 | -18 | -39 | -57 | McPhee, Graham | LW | USNTDP | NTDP |
| 150 | NR | 161 | -150 | 11 | Wiederer, Manuel | C | Moncton | QMJHL | |
| 152 | NR | NR | Jack Walker | LW | Victoria Royals | WHL | |||
| 154 | 82 | 113 | 31 | -72 | -41 | Stukel, Jakob | LW | Calgary | WHL |
| 158 | NR | NR | Patrick Kudla | D | Oakville Blades | OJHL | |||
| 159 | 104 | 114 | 10 | -55 | -45 | Hagel, Brandon | LW | Red Deer | WHL |
| 160 | 197 | NR | 37 | Pezzetta, Michael | C | Sudbury | OHL | ||
| 161 | 187 | NR | 26 | Clurman, Nathan | D | Culver Academy | USHS | ||
| 164 | 139 | 80 | -59 | -25 | -84 | Carroll, Noah | D | Guelph | OHL |
| 166 | 81 | NR | -85 | Phillips, Matthew | C | Victoria | WHL | ||
| 169 | 99 | 101 | 2 | -70 | -68 | Laczynski, Tanner | C | Lincoln | USHL |
| 170 | NR | NR | Collin Adams | LW | Muskegon | USHL | |||
| 171 | NR | NR | Gabriel Fontaine | C | Rouyn-Noranda | QMJHL | |||
| 172 | 84 | 126 | 42 | -88 | -46 | Salinitri, Anthony | C | Sarnia | OHL |
| 173 | NR | NR | Blake Hillman | D | Denver | NCAA | |||
| 177 | 126 | 183 | 57 | -51 | 6 | Priskie, Chase | D | Quinnipiac | NCAA |
| 179 | 136 | 103 | -33 | -43 | -76 | Mattinen, Nicolas | D | London | OHL |
| 180 | NR | NR | Mark Shoemaker | D | North Bay | OHL | |||
| 181 | 118 | 105 | -13 | -63 | -76 | Masonius, Joseph | D | U Connecticut | NCAA |
| 183 | NR | NR | Vincent Desharnais | D | Providence | NCAA | |||
| 184 | NR | 121 | -63 | Abols, Rodrigo | C | Portland | WHL | ||
| 185 | 206 | NR | 21 | Thurkauf, Calvin | C | Kelowna | WHL | ||
| 186 | 91 | 79 | -12 | -95 | -107 | Falkovsky, Stepan | D | Ottawa | OHL |
| 188 | 131 | 125 | -6 | -57 | -63 | Stewart, Dean | D | Portage | MJHL |
| 189 | 135 | 153 | 18 | -54 | -36 | Osmanski, Austin | D | Mississauga | OHL |
| 191 | 94 | 60 | -34 | -97 | -131 | Barron, Travis | LW | Ottawa | OHL |
| 192 | NR | NR | Jeremy Davies | D | Bloomington | USHL | |||
| 193 | 112 | 100 | -12 | -81 | -93 | Pastujov, Nick | LW | USNTDP | NTDP |
| 194 | NR | NR | Brett McKenzie | C | North Bay | OHL | |||
| 195 | NR | NR | Ben Finkelstein | D | Kimball Union | USHS | |||
| 196 | 129 | 91 | -38 | -67 | -105 | Sokolov, Dmitry | RW | Sudbury | OHL |
| 198 | NR | NR | Adam Smith | D | Bowling Green | NCAA | |||
| 200 | 144 | 201 | 57 | -56 | 1 | Quenneville, David | D | Medicine Hat | WHL |
| 201 | 88 | 82 | -6 | -113 | -119 | Ronning, Ty | RW | Vancouver | WHL |
| 202 | NR | NR | Jacob Friend | D | Owen Sound | OHL | |||
| 203 | 114 | 116 | 2 | -89 | -87 | Ryczek, Jake | D | Waterloo | USHL |
| 204 | NR | NR | Brayden Chizen | D | Kelowna | WHL | |||
| 205 | 150 | NR | -55 | Soy, Tyler | C | Victoria | WHL | ||
| 206 | 78 | 47 | -31 | -128 | -159 | Somppi, Otto | C | Halifax | QMJHL |
| 207 | NR | NR | Dmitriy Zaitsev | D | WBS Knights | NAHL | |||
| 208 | NR | NR | Ryan Lohin | C | Waterloo | USHL | |||
| 48 | 25 | -23 | Stransky, Simon | LW | Prince Albert | WHL | |||
| 55 | 44 | -11 | Kuznetsov, Vladimir | RW | Acadie-Bathurst | QMJHL | |||
| 58 | 53 | -5 | Gleason, Benjamin | D | Hamilton | OHL | |||
| 70 | 54 | -16 | Luce, Griffin | D | USNTDP | NTDP | |||
| 63 | 68 | 5 | Burke, Brayden | LW | Lethbridge | WHL | |||
| 102 | 70 | -32 | Vala, Ondrej | D | Kamloops | WHL | |||
| 113 | 71 | -42 | Bajkov, Patrick | LW | Everett | WHL | |||
| 107 | 72 | -35 | Neveu, Jacob | D | Rouyn-Noranda | QMJHL | |||
| 76 | 74 | -2 | Sylvestre, Gabriel | D | Shawinigan | QMJHL | |||
| 106 | 77 | -29 | Babenko, Egor | RW | Lethbridge | WHL | |||
| 142 | 78 | -64 | Gerlach, Maxwell | C | Medicine Hat | WHL | |||
| 128 | 85 | -43 | Graham, Michael | C | Eden Prairie | USHS | |||
| 119 | 86 | -33 | Suthers, Keenan | LW | USNTDP | NTDP | |||
| 132 | 89 | -43 | Eliot, Mitchell | D | Muskegon | USHL | |||
| 97 | 94 | -3 | O’Brien, Brogan | LW | Prince George | WHL | |||
| 182 | 96 | -86 | Crawley, Brandon | D | London | OHL | |||
| 117 | 97 | -20 | Johnson, Kenneth | D | Shattuck St. Mary | USHS | |||
| 80 | 98 | 18 | De Wit, Jeffrey | C | Red Deer | WHL | |||
| 123 | 99 | -24 | Rifai, Marshall | D | Hotchkiss School | USHS | |||
| 105 | 102 | -3 | Miromanov, Daniil | LW | Acadie-Bathurst | QMJHL | |||
| NR | 104 | 104 | Chernyuk, Konstantin | D | Kingston | OHL | |||
| 172 | 106 | -66 | Salituro, Dante | C | Ottawa | OHL | |||
| 207 | 107 | -100 | Buinitsky, Dmitri | LW | Madison | USHL | |||
| 161 | 109 | -52 | Perunovich, Scott | D | Hibbing/Chisholm | USHS | |||
| 190 | 110 | -80 | Campoli, Michael | D | USNTDP | NTDP | |||
| 103 | 111 | 8 | Maksimovich, Kyle | LW | Erie | OHL | |||
| 193 | 112 | -81 | Balmas, Mitchell | C | Charlottetown | QMJHL | |||
| 120 | 115 | -5 | Sevigny, Mathieu | LW | Drummondville | QMJHL | |||
| 141 | 118 | -23 | McInnis, Luke | D | Youngstown | USHL | |||
| 134 | 119 | -15 | Lyszczarczyk, Alan | LW | Sudbury | OHL | |||
| NR | 120 | Galipeau, Olivier | D | Val-D’or | QMJHL | ||||
| 111 | 123 | 12 | Commisso, Domenic | C | Oshawa | OHL | |||
| 160 | 127 | -33 | Printz, Gregory | RW | Selects Academy | USHS | |||
| 121 | 128 | 7 | Greenway, James | D | USNTDP | NTDP | |||
| 152 | 129 | -23 | Dodero, Christopher | LW | Sioux City | USHL | |||
| 149 | 130 | -19 | Knierim, William | RW | Dubuque | USHL | |||
| 151 | 131 | -20 | Olischefski, Kohen | RW | Chilliwack | BCHL | |||
| 124 | 133 | 9 | Armstrong, Jamie | LW | Avon Farms | USHS | |||
| 208 | 134 | -74 | Dusek, Filip | D | Stanstead College | CAN HS | |||
| 146 | 135 | -11 | Sanchez, James | LW | USNTDP | NTDP | |||
| 170 | 138 | -32 | Grant, Owen | D | Carleton Place | CCHL | |||
| 167 | 139 | -28 | Felhaber, Tye | C | Saginaw | OHL | |||
| 177 | 140 | -37 | Hebig, Cameron | C | Saskatoon | WHL | |||
| 189 | 142 | -47 | Felixson, Oliver | D | Saint John | QMJHL | |||
| NR | 143 | 143 | Rymsha, Drake | C | Ottawa | OHL | |||
| 116 | 144 | 28 | Westlund, Gustaf | C | The Gunnery | USHS | |||
| 145 | 145 | 0 | Fortier, Maxime | RW | Halifax | QMJHL | |||
| 115 | 147 | 32 | Pasichnuk, Brinson | D | Bonnyville | AJHL | |||
| 168 | 150 | -18 | Coleman, Luke | LW | Prince Albert | WHL | |||
| 164 | 152 | -12 | Soustal, Tomas | C | Kelowna | WHL | |||
| NR | 154 | 154 | Jeffers, Jack | LW | Orangeville | OJHL | |||
| NR | 155 | 155 | Berg, Adam | LW | Regina | WHL | |||
| 133 | 156 | 23 | Bilodeau, Gabriel | D | Gatineau | QMJHL | |||
| 147 | 157 | 10 | Betts, Kyle | C | Powell River | BCHL | |||
| 153 | 158 | 5 | Bower, William | C | Moncton | QMJHL | |||
| NR | 159 | 159 | Hawerchuk, Benjamin | LW | Barrie | OHL | |||
| 148 | 160 | 12 | Saigeon, Brandon | C | Hamilton | OHL | |||
| 154 | 162 | 8 | Karashik, Adam | D | Avon Farms | USHS | |||
| 166 | 163 | -3 | Walker, Zachary | RW | USNTDP | NTDP | |||
| 125 | 164 | 39 | Verbeek, Hayden | C | Sault Marie | OHL | |||
| NR | 165 | Huber, Mario | C | Victoriaville | QMJHL | ||||
| NR | 166 | Kirwan, Luke | LW | Flint | OHL | ||||
| 173 | 167 | -6 | Gardiner, Reid | RW | Prince Albert | WHL | |||
| NR | 168 | Jette, Tyler | D | Farmington | USHS | ||||
| 174 | 169 | -5 | Ottenbreit, Turner | D | Seattle | WHL | |||
| 127 | 170 | 43 | Spaxman, Ethan | D | Merrimack | NCAA | |||
| 137 | 171 | 34 | Murray, Justin | D | Barrie | OHL | |||
| 191 | 172 | -19 | Hampton, Robert | C | Chicago | USHL | |||
| 101 | 173 | 72 | Kachyna, Ondrej | D | Hamilton | OHL | |||
| NR | 174 | Picard, Miguel | C | Blainville | QMJHL | ||||
| 195 | 175 | -20 | Rossini, Samuel | D | Waterloo | USHL | |||
| NR | 176 | Westgard, Ty | C | Victoria | WHL | ||||
| 155 | 177 | 22 | Coghlan, Dylan | D | Tri-City | WHL | |||
| 194 | 178 | -16 | Hakkarainen, Mikael | C | Brookings | NAHL | |||
| 122 | 179 | 57 | O’Neil, Kevin | C | Albany | USHS | |||
| NR | 180 | Kutkevicius, Luke | C | Hamilton | OHL | ||||
| 188 | 181 | -7 | De Jong, Brendan | D | Portland | WHL | |||
| NR | 182 | Mieritz, Christian | D | Guelph | OHL | ||||
| 196 | 184 | -12 | Gosiewski, Matt | C | Cedar Rapids | USHL | |||
| NR | 185 | Dillon, Matt | D | Cushing Academy | USHS | ||||
| 178 | 186 | 8 | Grannary, Colin | C | Merritt | BCHL | |||
| NR | 188 | Maltsev, Artem | D | Chicoutimi | QMJHL | ||||
| NR | 189 | Jerry, William | C | St. Thomas | USHS | ||||
| NR | 190 | Fryer, Callum | D | Umass | NCAA | ||||
| NR | 191 | Werbik, Nicolas | C | Rimouski | QMJHL | ||||
| 138 | 193 | 55 | Dickinson, Josh | C | Georgetown | OJHL | |||
| 194 | Kislinger, Maximilian | LW | North Bay | OHL | |||||
| 195 | Malmquist, Dylan | C | Notre Dame | NCAA | |||||
| 210 | 196 | -14 | Klima, Kevin | C | Moncton | QMJHL | |||
| 197 | Davidson, Dawson | D | Kamloops | WHL | |||||
| 198 | Murphy, Liam | C | Moncton | QMJHL | |||||
| 199 | Poirier, Zachary | C | North Bay | OHL | |||||
| 200 | De Mey, Vincent | RW | Shattuck St. Mary | USHS | |||||
| 163 | 202 | 39 | Mcewan, James | C | Guelph | OHL | |||
| 198 | 204 | 6 | Maher, Jordan | RW/C | Acadie-Bathurst | QMJHL | |||
| NR | 205 | Long, Carter | D | Selects Academy | USHS | ||||
| NR | 206 | Volcan, Nolan | LW | Seattle | WHL | ||||
| 179 | 207 | 28 | Brazeau, Justin | RW | North Bay | OHL | |||
| 175 | 208 | 33 | Matthews, Brian | D | Belmont Hill | USHS | |||
| NR | 209 | D’astous, Charles-Edouard | D | Rimouski | QMJHL | ||||
| NR | 210 | Aamodt, Wyatt | D | Hermantown | USHS | ||||
| 140 | NR | Sissons, Colby | D | Swift Current | WHL | ||||
| 157 | NR | Fear, Erich | D | Springfield | NAHL | ||||
| 158 | NR | Laberge, Samuel | LW | Rimouski | QMJHL | ||||
| 162 | NR | Duehr, Walker | RW | Tri-City | USHL | ||||
| 165 | NR | Bavaro, Vito | RW | Brooks School | USHS | ||||
| 169 | NR | MacNab, Jackson | RW | Culver Academy | USHS | ||||
| 176 | NR | Topping, Jordan | LW | Tri-City | WHL | ||||
| 180 | NR | Jordan, Zachary | RW | Des Moines | USHL | ||||
| 181 | NR | Truchon Viel, Jeffrey | LW | Acadie-Bathurst | QMJHL | ||||
| 183 | NR | Luff, Matt | RW | Hamilton | OHL | ||||
| 184 | NR | Hirano, Yushiroh | RW | Youngstown | USHL | ||||
| 186 | NR | Nother, Tyler | D | Windsor | OHL | ||||
| 199 | NR | Steenbergen, Tyler | C | Swift Current | WHL | ||||
| 200 | NR | Russell, Rourke | D | Wichita Falls | NAHL | ||||
| 201 | NR | Amonte, Ty | RW | Thayer Academy | USHS | ||||
| 202 | NR | Allen, Sean | D | Oshawa | OHL | ||||
| 204 | NR | Bobyk, Colton | D | Red Deer | WHL | ||||
| 205 | NR | Muzito Bagenda, Daniel | RW | Mississauga | OHL |
Chart 2-02
2017 Central Scouting Data
| Draft | CS Final | CS Midterm | Mid-Final | Final-Draft | Mid-Draft | Name | Pos | Team | League |
| 1 | 2 | 2 | 0 | 1 | 1 | HISCHIER, NICO | C | Halifax | QMJHL |
| 2 | 1 | 1 | 0 | -1 | -1 | PATRICK, NOLAN | C | Brandon | WHL |
| 4 | 9 | 10 | 1 | 5 | 6 | MAKAR, CALE | D | BROOKS | AJHL |
| 6 | 6 | 8 | 2 | 0 | 2 | GLASS, CODY | C | PORTLAND | WHL |
| 8 | 3 | 5 | 2 | -5 | -3 | MITTELSTADT, CASEY | C | Eden Prairie | USHS |
| 9 | 5 | 6 | 1 | -4 | -3 | RASMUSSEN, MICHAEL | C | TRI-CITY | WHL |
| 10 | 7 | 4 | -3 | -3 | -6 | TIPPETT, OWEN | RW | MISSISSAUGA | OHL |
| 11 | 4 | 3 | -1 | -7 | -8 | VILARDI, GABRIEL | C | KINGSTON | OHL |
| 13 | 10 | 16 | 6 | -3 | 3 | SUZUKI, NICK | C | OWEN SOUND | OHL |
| 14 | 12 | 12 | 0 | -2 | -2 | FOOTE, CALLAN | D | KELOWNA | WHL |
| 16 | 11 | 9 | -2 | -5 | -7 | VALIMAKI, JUUSO | D | TRI-CITY | WHL |
| 19 | 34 | 46 | 12 | 15 | 27 | NORRIS, JOSHUA | C | USNTDP | NTDP |
| 20 | 22 | 28 | 6 | 2 | 8 | THOMAS, ROBERT | C | HAMILTON | OHL |
| 22 | 17 | 17 | 0 | -5 | -5 | YAMAMOTO, KAILER | RW | SPOKANE | WHL |
| 23 | 27 | 42 | 15 | 4 | 19 | JOSEPH, PIERRE-OLIVIER | D | CHARLOTTETOWN | QMJHL |
| 25 | 13 | 14 | 1 | -12 | -11 | POEHLING, RYAN | C | ST. CLOUD STATE | NCAA |
| 27 | 31 | 29 | -2 | 4 | 2 | FROST, MORGAN | C | SAULT STE. MARIE | OHL |
| 28 | 16 | 13 | -3 | -12 | -15 | BOWERS, SHANE | C | Waterloo | USHL |
| 29 | 19 | 22 | 3 | -10 | -7 | JOKIHARJU, HENRI | D | PORTLAND | WHL |
| 30 | 8 | 7 | -1 | -22 | -23 | TOLVANEN, EELI | RW | Sioux City | USHL |
| 32 | 18 | 26 | 8 | -14 | -6 | TIMMINS, CONOR | D | SAULT STE. MARIE | OHL |
| 33 | 23 | 21 | -2 | -10 | -12 | LIND, KOLE | RW | KELOWNA | WHL |
| 34 | 20 | 11 | -9 | -14 | -23 | HAGUE, NICOLAS | D | MISSISSAUGA | OHL |
| 35 | 15 | 20 | 5 | -20 | -15 | RATCLIFFE, ISAAC | LW | GUELPH | OHL |
| 39 | 14 | 34 | 20 | -25 | -5 | ROBERTSON, JASON | LW | KINGSTON | OHL |
| 40 | 26 | 36 | 10 | -14 | -4 | HEPONIEMI, ALEKSI | C | SWIFT CURRENT | WHL |
| 41 | 21 | 40 | 19 | -20 | -1 | ANDERSON-DOLAN, JARET | C | SPOKANE | WHL |
| 43 | 67 | 43 | -24 | 24 | 0 | SAMBERG, DYLAN | D | MINN-DULUTH | NCAA |
| 47 | 29 | 24 | -5 | -18 | -23 | FORMENTON, ALEX | LW | LONDON | OHL |
| 49 | 78 | 107 | 29 | 29 | 58 | FERRARO, MARIO | D | Muskegon | USHL |
| 50 | 30 | 15 | -15 | -20 | -35 | COMTOIS, MAXIME | LW | VICTORIAVILLE | QMJHL |
| 51 | 143 | 164 | 21 | 92 | 113 | LAUZON, ZACHARY | D | ROUYN-NORANDA | QMJHL |
| 52 | 61 | 67 | 6 | 9 | 15 | MARTIN, LUKE | D | USNTDP | NTDP |
| 53 | 120 | 80 | -40 | 67 | 27 | STUDNICKA, JACK | C | OSHAWA | OHL |
| 55 | 39 | 60 | 21 | -16 | 5 | GADJOVICH, JONAH | LW | OWEN SOUND | OHL |
| 56 | 49 | 75 | 26 | -7 | 19 | BROOK, JOSH | D | MOOSE JAW | WHL |
| 57 | 35 | 45 | 10 | -22 | -12 | MITCHELL, IAN | D | SPRUCE GROVE | AJHL |
| 59 | 32 | 57 | 25 | -27 | -2 | RASANEN, EEMELI | D | KINGSTON | OHL |
| 60 | 53 | 54 | 1 | -7 | -6 | MORAND, ANTOINE | C | ACADIE-BATHURST | QMJHL |
| 61 | 24 | 30 | 6 | -37 | -31 | MISMASH, GRANT | LW | USNTDP | NTDP |
| 62 | 42 | 31 | -11 | -20 | -31 | LESCHYSHYN, JAKE | C | REGINA | WHL |
| 66 | 54 | 76 | 22 | -12 | 10 | GILDON, MAXWELL | D | USNTDP | NTDP |
| 67 | 45 | 50 | 5 | -22 | -17 | GEEKIE, MORGAN | C | TRI-CITY | WHL |
| 68 | 90 | 153 | 63 | 22 | 85 | WALFORD, SCOTT | D | VICTORIA | WHL |
| 69 | 44 | 35 | -9 | -25 | -34 | ENTWISTLE, MACKENZIE | RW | HAMILTON | OHL |
| 71 | 92 | 89 | -3 | 21 | 18 | KOTKANSALO, KASPER | D | SIOUX FALLS | USHL |
| 73 | 38 | 23 | -15 | -35 | -50 | MATTHEOS, STELIO | RW | BRANDON | WHL |
| 74 | 155 | NR | 81 | KOVACEVIC, JOHNATHAN | D | MERRIMACK | NCAA | ||
| 75 | 47 | 32 | -15 | -28 | -43 | SCHNARR, NATE | C | GUELPH | OHL |
| 77 | 63 | 48 | -15 | -14 | -29 | MIRAGEAS, BENJAMIN | D | CHICAGO | USHL |
| 79 | 52 | 70 | 18 | -27 | -9 | ZABLOCKI, LANE | RW | VICTORIA | WHL |
| 81 | 60 | 65 | 5 | -21 | -16 | WALSH, REILLY | D | PROCTOR | USHS |
| 82 | 89 | 68 | -21 | 7 | -14 | CROTTY, CAMERON | D | BROCKVILLE | CCHL |
| 83 | 64 | 71 | 7 | -19 | -12 | GALLANT, ZACH | C | PETERBOROUGH | OHL |
| 84 | 69 | 122 | 53 | -15 | 38 | SAMORUKOV, DMITRI | D | GUELPH | OHL |
| 85 | 36 | 37 | 1 | -49 | -48 | LODNIA, IVAN | RW | ERIE | OHL |
| 87 | 62 | 74 | 12 | -25 | -13 | FLEURY, CALE | D | REGINA | WHL |
| 90 | 65 | 55 | -10 | -25 | -35 | BARRATT, EVAN | C | USNTDP | NTDP |
| 91 | NR | NR | Jack Badini | C | CHICAGO STEEL | USHL | |||
| 92 | 46 | 52 | 6 | -46 | -40 | FARRANCE, DAVID | D | USNTDP | NTDP |
| 93 | 99 | 72 | -27 | 6 | -21 | PHILLIPS, CLAYTON | D | FARGO FORCE | USHL |
| 94 | 25 | 25 | 0 | -69 | -69 | HENRY, NICK | RW | REGINA | WHL |
| 95 | 57 | 78 | 21 | -38 | -17 | RATHBONE, JACK | D | DEXTER SCHOOL | USHS |
| 97 | 55 | 63 | 8 | -42 | -34 | SHAW, MASON | C | MEDICINE HAT | WHL |
| 98 | 28 | 18 | -10 | -70 | -80 | POPUGAEV, NIKITA | LW | Prince George | WHL |
| 99 | -99 | -99 | Jacob Bryson | D | PROVIDENCE | NCAA | |||
| 101 | 141 | NR | 40 | HAWEL, LIAM | C | GUELPH | OHL | ||
| 102 | 40 | 47 | 7 | -62 | -55 | REEDY, SCOTT | C | USNTDP | NTDP |
| 103 | 51 | 56 | 5 | -52 | -47 | ANDERSON, MICHAEL | D | Waterloo | USHL |
| 106 | 33 | 19 | -14 | -73 | -87 | STROME, MATTHEW | LW | HAMILTON | OHL |
| 107 | 72 | 73 | 1 | -35 | -34 | SUSHKO, MAKSIM | RW | OWEN SOUND | OHL |
| 108 | 75 | 41 | -34 | -33 | -67 | HOEFENMAYER, NOEL | D | OTTAWA | OHL |
| 109 | 37 | 27 | -10 | -72 | -82 | RUZICKA, ADAM | C | SARNIA | OHL |
| 116 | 85 | 101 | 16 | -31 | -15 | MISLEY, BRYCE | C | OAKVILLE | OJHL |
| 118 | 50 | 62 | 12 | -68 | -56 | PHILLIPS, MARKUS | D | OWEN SOUND | OHL |
| 121 | 117 | NR | -4 | BATHERSON, DRAKE | C | BLAINVILLE-BOISBRIAND | QMJHL | ||
| 122 | 56 | 58 | 2 | -66 | -64 | OLSON, KYLE | RW | TRI-CITY | WHL |
| 123 | 199 | NR | 76 | CRAWLEY, BRANDON | D | London Knights | OHL | ||
| 126 | 109 | 117 | 8 | -17 | -9 | KAROW, MICHAEL | D | YOUNGSTOWN | USHL |
| 128 | 70 | 138 | 68 | -58 | 10 | STEENBERGEN, TYLER | C | SWIFT CURRENT | WHL |
| 130 | 136 | NR | 6 | NOEL, DAVID | D | VAL-D’OR | QMJHL | ||
| 131 | 197 | 206 | 9 | 66 | 75 | FRASER, COLE | D | PETERBOROUGH | OHL |
| 133 | 68 | 64 | -4 | -65 | -69 | INAMOTO, TYLER | D | USNTDP | NTDP |
| 134 | NR | NR | HULTS, COLE | D | MADISON | USHL | |||
| 136 | 200 | 200 | 0 | 64 | 64 | GAWANKE, LEON | D | CAPE BRETON | QMJHL |
| 137 | 121 | 145 | 24 | -16 | 8 | CATES, NOAH | LW | STILLWATER | USHS |
| 138 | 118 | NR | -20 | RYMSHA, DRAKE | C | SARNIA | OHL | ||
| 140 | NR | NR | FISCHER, ZACK | RW | MEDICINE HAT | WHL | |||
| 141 | 104 | 188 | 84 | -37 | 47 | GORDEEV, FEDOR | D | FLINT | OHL |
| 142 | 108 | 82 | -26 | -34 | -60 | DUGAN, JONATHAN | LW | NORTHWOOD | USHS |
| 143 | 101 | 86 | -15 | -42 | -57 | STUDENIC, MARIAN | RW | HAMILTON | OHL |
| 144 | NR | NR | FOO, PARKER | LW | BROOKS BANDITS | AJHL | |||
| 146 | 66 | 185 | 119 | -80 | 39 | MAKSIMOV, KIRILL | RW | NIAGARA | OHL |
| 147 | 144 | 143 | -1 | -3 | -4 | GOLDEN, JACOB | D | LONDON | OHL |
| 148 | 128 | 129 | 1 | -20 | -19 | HOWARTH, KALE | LW | Trail Smoke | BCHL |
| 149 | 41 | 33 | -8 | -108 | -116 | TYSZKA, JARRET | D | SEATTLE | WHL |
| 156 | 167 | 131 | -36 | 11 | -25 | SMIRNOV, DENIS | RW | PENN STATE | NCAA |
| 158 | 73 | 111 | 38 | -85 | -47 | CAMPOLI, NICK | C | NORTH YORK | OJHL |
| 159 | NR | NR | MCGREW, JACOB | RW | SPOKANE | WHL | |||
| 162 | NR | NR | Jack Adams | C | Fargo Force | USHL | |||
| 163 | 142 | 142 | 0 | -21 | -21 | DAVIS, BRETT | RW | KOOTENAY | WHL |
| 164 | NR | NR | Reilly Webb | D | Hamilton | OHL | |||
| 165 | 177 | NR | 12 | DURANDEAU, ARNAUD | LW | HALIFAX | QMJHL | ||
| 166 | 87 | 109 | 22 | -79 | -57 | DE JONG, BRENDAN | D | PORTLAND | WHL |
| 169 | NR | 187 | 187 | 18 | PERBIX, NICKLAUS | D | ELK RIVER HS | USHS | |
| 171 | 102 | 125 | 23 | -69 | -46 | JOLY, D’ARTAGNAN | RW | BAIE-COMEAU | QMJHL |
| 172 | 107 | 79 | -28 | -65 | -93 | MCGREGOR, RYAN | C | SARNIA | OHL |
| 173 | 146 | 203 | 57 | -27 | 30 | PARE, CEDRIC | C | SAINT JOHN | QMJHL |
| 174 | 98 | 88 | -10 | -76 | -86 | BARRON, MORGAN | C | ST. ANDREWS | CA HS |
| 175 | 154 | NR | -21 | BOURQUE, TRENTON | D | OWEN SOUND | OHL | ||
| 176 | 83 | 44 | -39 | -93 | -132 | KOLTYGIN, PAVEL | C | DRUMMONDVILLE | QMJHL |
| 177 | 157 | 202 | 45 | -20 | 25 | BRIND’AMOUR, SKYLER | C | SELECTS ACADEMY | USHS |
| 179 | 151 | 116 | -35 | -28 | -63 | MEYER, CARSON | RW | MIAMI | NCAA |
| 180 | NR | NR | Cole Guttman | C | DUBUQUE | USHL | |||
| 181 | NR | NR | Petrus Palmu | RW | OWEN SOUND | OHL | |||
| 182 | 159 | 158 | -1 | -23 | -24 | MAASS, BENTON | D | ELK RIVER | USHS |
| 185 | 43 | 38 | -5 | -142 | -147 | CHMELEVSKI, ALEXANDER | C | OTTAWA | OHL |
| 187 | 119 | 114 | -5 | -68 | -73 | LEIVERMANN, NICK | D | EDEN PRAIRIE | USHS |
| 188 | 137 | NR | -51 | BRASSARD, MATT | D | OSHAWA | OHL | ||
| 189 | 170 | 99 | -71 | -19 | -90 | JONES, BEN | C | NIAGARA | OHL |
| 191 | 126 | 95 | -31 | -65 | -96 | CHAINEY, JOCKTAN | D | HALIFAX | QMJHL |
| 192 | 139 | NR | -53 | WEISSBACH, LINUS | LW | TRI CITY | USHL | ||
| 193 | NR | NR | GILMOUR, BRADY | C | SAGINAW | OHL | |||
| 196 | NR | NR | KALYNUK, WYATT | D | BLOOMINGTON | USHL | |||
| 198 | 176 | -22 | MCKENZIE, SKYLER | LW | PORTLAND | WHL | |||
| 200 | NR | NR | WALKER, SAMUEL | C | Edina HS | USHS | |||
| 201 | 214 | 192 | -22 | 13 | -9 | COCKERILL, LOGAN | LW | USNTDP | NTDP |
| 203 | 208 | NR | 5 | O’CONNELL, RYAN | D | ST. ANDREWS | CA HS | ||
| 204 | 173 | NR | -31 | BUKAC, DANIEL | D | BRANDON | WHL | ||
| 208 | 175 | 179 | 4 | -33 | -29 | KEMP, PHILIP | D | USNTDP | NTDP |
| 209 | 138 | 182 | 44 | -71 | -27 | SWANEY, NICK | RW | WATERLOO | USHL |
| 210 | 88 | 108 | 20 | -122 | -102 | STUCKER, ROBBIE | D | ST. THOMAS | USHS |
| 211 | NR | NR | EVINGSON, CROIX | D | SHREVPORT | NAHL | |||
| 212 | 71 | 51 | -20 | -141 | -161 | CHEKHOVICH, IVAN | LW | BAIE-COMEAU | QMJHL |
| 214 | NR | NR | HELLICKSON, MATTHEW | D | SIOUX CITY | USHL | |||
| 215 | NR | NR | ESS, JOSHUA | D | LAKEVILLE SOUTH | USHS | |||
| 216 | 105 | 90 | -15 | -111 | -126 | PAQUETTE, JACOB | D | KINGSTON | OHL |
| 217 | NR | NR | Will Reilly | D | RPI | NCAA | |||
| 93 | 39 | -54 | 93 | 39 | MEIRELES, GREG | C | KITCHENER | OHL | |
| 51 | 43 | -8 | 51 | 43 | SALDA, RADIM | D | SAINT JOHN | QMJHL | |
| 58 | 49 | -9 | 58 | 49 | MINULIN, ARTYOM | D | SWIFT CURRENT | WHL | |
| 48 | 53 | 5 | 48 | 53 | LYLE, BRADY | D | OWEN SOUND | OHL | |
| 96 | 59 | -37 | 96 | 59 | THILANDER, ADAM | D | NORTH BAY | OHL | |
| 81 | 61 | -20 | 81 | 61 | MILLER, THOMAS | D | USNTDP | NTDP | |
| 76 | 66 | -10 | 76 | 66 | CRETE-BELZILE, ANTOINE | D | Blainville | QMJHL | |
| 94 | 69 | -25 | 94 | 69 | BINNER, ALEXIS | D | GREEN BAY | USHL | |
| 84 | 77 | -7 | 84 | 77 | TEASDALE, JOEL | LW | BLAINVILLE | QMJHL | |
| NR | 81 | MILLER, MATT | C | SIOUX CITY | USHL | ||||
| 103 | 83 | -20 | 103 | 83 | PRATT, AUSTIN | RW | REGINA | WHL | |
| 77 | 84 | 7 | 77 | 84 | COGHLAN, DYLAN | D | TRI-CITY | WHL | |
| 114 | 85 | -29 | 114 | 85 | ALEXEYEV, YAROSLAV | LW | SHERBROOKE | QMJHL | |
| 86 | 87 | 1 | 86 | 87 | PECKFORD, RYAN | LW | MOOSE JAW | WHL | |
| 82 | 91 | 9 | 82 | 91 | BELLERIVE, JORDAN | C | LETHBRIDGE | WHL | |
| 115 | 92 | -23 | 115 | 92 | KEATING, AUSTEN | LW | OTTAWA | OHL | |
| 110 | 93 | -17 | 110 | 93 | MOILANEN, SAMI | RW | SEATTLE | WHL | |
| 125 | 94 | -31 | 125 | 94 | ST. IVANY, JOHN | D | SIOUX FALLS | USHL | |
| 150 | 96 | -54 | 150 | 96 | COSKEY, COLE | RW | SAGINAW | OHL | |
| 171 | 97 | -74 | 171 | 97 | BUCEK, SAMUEL | LW | SHAWNIGAN | QMJHL | |
| 149 | 98 | -51 | 149 | 98 | SMART, JONATHAN | D | KOOTENAY | WHL | |
| 123 | 100 | -23 | 123 | 100 | SEITZ, DYLAN | C | MONCTON | QMJHL | |
| 100 | 102 | 2 | 100 | 102 | NYMAN, LINUS | RW | KINGSTON | OHL | |
| 185 | 103 | -82 | 185 | 103 | BOUDRIAS, SHAWN | RW | GATINEAU | QMJHL | |
| NR | 104 | WASHE, PAUL | C | FARGO FORCE | USHL | ||||
| 59 | 105 | 46 | 59 | 105 | LEWIS, TY | LW | BRANDON | WHL | |
| 79 | 106 | 27 | 79 | 106 | KNOEPKE, NATHAN | D | USNTDP | NTDP | |
| 135 | 110 | -25 | 135 | 110 | PLOUFFE, DYLAN | D | VANCOUVER | WHL | |
| 204 | 112 | -92 | 204 | 112 | BOWEN, RYAN | RW | LETHBRIDGE | WHL | |
| 162 | 113 | -49 | 162 | 113 | SIROTA, JAKUB | D | CEDAR RAPIDS | USHL | |
| 122 | 115 | -7 | 122 | 115 | DOW, BOBBY | RW | PETERBOROUGH | OHL | |
| 97 | 118 | 21 | 97 | 118 | JOHNSON, ISAAC | LW | TRI-CITY | WHL | |
| 140 | 119 | -21 | 140 | 119 | RUBINCHIK, MARK | D | SASKATOON | WHL | |
| 147 | 120 | -27 | 147 | 120 | GORDA, BRAYDEN | D | EDMONTON | WHL | |
| 165 | 121 | -44 | 165 | 121 | TORTORA, JACOB | LW | USNTDP | NTDP | |
| 112 | 123 | 11 | 112 | 123 | BOOMHOWER, SHAW | LW | OTTAWA | OHL | |
| 156 | 124 | -32 | 156 | 124 | AHCAN, JACK | D | ST. CLOUD STATE | NCAA | |
| 193 | 126 | -67 | 193 | 126 | FLOWER, WALTER | D | HALIFAX | QMJHL | |
| 106 | 127 | 21 | 106 | 127 | KHODORENKO, PATRICK | C | MICHIGAN STATE | NCAA | |
| 111 | 128 | 17 | 111 | 128 | ANDERSON, MATT | D | HOLY FAMILY | USHS | |
| 133 | 130 | -3 | 133 | 130 | LEASON, BRETT | C | PRINCE ALBERT | WHL | |
| 179 | 132 | -47 | 179 | 132 | PIETRONIRO, MATTEO | D | BAIE COMEAU | QMJHL | |
| 182 | 133 | -49 | 182 | 133 | KASTELIC, MARK | C | CALGARY | WHL | |
| 210 | 134 | -76 | 210 | 134 | WED, MATTHEW | C | SEATTLE | WHL | |
| 213 | 135 | -78 | 213 | 135 | DEAKIN-POOT, NICHOLAS | C | SAINT JOHN | QMJHL | |
| 181 | 136 | -45 | 181 | 136 | FORTIER, MAXIME | RW | HALIFAX | QMJHL | |
| 198 | 137 | -61 | 198 | 137 | VESTERINEN, SAKU | D | CHARLOTTETOWN | QMJHL | |
| 124 | 139 | 15 | 124 | 139 | DURZI, SEAN | D | OWEN SOUND | OHL | |
| 168 | 140 | -28 | 168 | 140 | HALBGEWACHS, JAYDEN | C | MOOSE JAW | WHL | |
| 132 | 141 | 9 | 132 | 141 | MCINDOE, ETHAN | LW | SPOKANE | WHL | |
| 127 | 144 | 17 | 127 | 144 | STINIL, MICHAL | LW | SO. SHORE KINGS | NCDC | |
| 180 | 146 | -34 | 180 | 146 | SLAGGERT, GRAHAM | C | USNTDP | NTDP | |
| 215 | 147 | -68 | 215 | 147 | MACHALA, ONDREJ | LW | NIAGARA | OHL | |
| 91 | 148 | 57 | 91 | 148 | HANCOCK, KEVIN | LW | OWEN SOUND | OHL | |
| NR | 149 | GREEN, CORSON | D | SIOUX FALLS | USHL | ||||
| 160 | 150 | -10 | 160 | 150 | THOMPSON, TYCE | RW | SALISBURY | USHS | |
| NR | 151 | KRIEF, ALEXANDER | D | SHERBROOKE | QMJHL | ||||
| 202 | 152 | -50 | 202 | 152 | HAYES, ZACKARY | D | PRINCE ALBERT | WHL | |
| 134 | 154 | 20 | 134 | 154 | WARM, WILL | D | EDMONTON | WHL | |
| 129 | 155 | 26 | 129 | 155 | EVANS, FINN | RW | OTTAWA | CCHL | |
| 172 | 156 | -16 | 172 | 156 | HARTIKAINEN, SANTERI | C | NORTHWOOD | USHS | |
| 161 | 157 | -4 | 161 | 157 | MILLER, MICAH | RW | CEDAR RAPIDS HS | USHS | |
| 188 | 159 | -29 | 188 | 159 | LELLIG, HUNTER | D | WATERLOO | USHL | |
| 190 | 160 | -30 | 190 | 160 | WILKINS, JOSHUA | C | PROVIDENCE | NCAA | |
| NR | 161 | DEMEO, ANTHONY | D | SAULT STE. MARIE | OHL | ||||
| NR | 162 | MICHNAC, ALBERT | LW | MISSISSAUGA | OHL | ||||
| 205 | 163 | -42 | 205 | 163 | PATERSON, JOSH | RW | SASKATOON | WHL | |
| 74 | 165 | 91 | 74 | 165 | KELLENBERGER, MATTHEW | D | OAKVILLE | OJHL | |
| NR | 166 | SVOBODA, MATYAS | LW | SIOUX CITY | USHL | ||||
| NR | 167 | RUBINS, KRISTIANS | D | MEDICINE HAT | WHL | ||||
| 148 | 168 | 20 | 148 | 168 | ISAACSON, NICK | LW | PETERBOROUGH | OHL | |
| NR | 169 | BJUGSTAD, JESSE | D | STILLWATER | USHS | ||||
| NR | 170 | LE COULTRE, SIMON | D | MONCTON | QMJHL | ||||
| 116 | 171 | 55 | 116 | 171 | LAGUNOV, PHILLIP | C | BURLINGTON | OJHL | |
| 163 | 172 | 9 | 163 | 172 | GANSKE, NOAH | D | MN MAGICIANS | NAHL | |
| 152 | 173 | 21 | 152 | 173 | PHILIP, MATTHEW | C | NIAGARA | OHL | |
| 194 | 174 | -20 | 194 | 174 | CONRAD, COLT | C | WEST MICHIGAN | NCAA | |
| 187 | 175 | -12 | 187 | 175 | BURKE, BRAYDEN | LW | MOOSE JAW | WHL | |
| 145 | 176 | 31 | 145 | 176 | MCHUGH, NICHOLAS | LW | KITCHENER | OHL | |
| 169 | 177 | 8 | 169 | 177 | HUGHES, RYAN | C | PORTLAND | WHL | |
| 191 | 178 | -13 | 191 | 178 | MCMANUS, BRANNON | RW | OMAHA | USHL | |
| 113 | 180 | 67 | 113 | 180 | ROBERTS, ZACHARY | LW | OWEN SOUND | OHL | |
| NR | 181 | HOLT, DAWSON | C | VANCOUVER | WHL | ||||
| NR | 183 | CARSON, MACAULEY | C | SUDBURY | OHL | ||||
| NR | 184 | SCHEERER, BRAM | LW | EDINA | USHS | ||||
| NR | 186 | LEE, CAMERON | D | WEST MICHIGAN | NCAA | ||||
| 164 | 189 | 25 | 164 | 189 | CASTLEMAN, OLIVER | LW | NIAGARA | OHL | |
| NR | 190 | SEMCHUK, BRENDAN | RW | EDMONTON | WHL | ||||
| NR | 191 | GARREFFA, JOSEPH | LW | KITCHENER | OHL | ||||
| NR | 193 | MIKHNIN, DENIS | RW | RIMOUSKI | QMJHL | ||||
| 189 | 194 | 5 | 189 | 194 | PURBOO, COLE | RW | WINDSOR | OHL | |
| 184 | 195 | 11 | 184 | 195 | ANDONOVSKI, COREY | RW | CHILLIWACK | BCHL | |
| 178 | 196 | 18 | 178 | 196 | SHEA, NEIL | LW | LAWRENCE | USHS | |
| 174 | 197 | 23 | 174 | 197 | GRISHAKOV, ANDREI | RW | VICTORIA | WHL | |
| 186 | 198 | 12 | 186 | 198 | KOSORENKOV, IVAN | RW | VICTORIAVILLE | QMJHL | |
| 95 | 199 | 104 | 95 | 199 | YERYOMENKO, VLADISLAV | D | CALGARY | WHL | |
| NR | 201 | MOYLE, NOLAN | RW | GREEN BAY | USHL | ||||
| 212 | 204 | -8 | 212 | 204 | DUQUETTE, MARC-OLIVIER | D | DRUMMONDVILLE | QMJHL | |
| NR | 205 | HEDBERG, TOM | D | Barrie Colts | OHL | ||||
| NR | 207 | NEWPOWER, WYATT | D | UCONN | NCAA | ||||
| NR | 208 | ROBERTS, ELIJAH | D | NIAGARA | OHL | ||||
| NR | 209 | GRIMA, NICHOLAS | D | SARNIA | OHL | ||||
| NR | 210 | WALKER, ZACHARY | RW | BOSTON COLLEGE | NCAA | ||||
| 201 | 211 | 10 | 201 | 211 | BOKA, LUCAS | RW | WINDSOR | OHL | |
| NR | 212 | PASICHNUK, BRINSON | D | ARIZONA STATE | NCAA | ||||
| NR | 213 | GOURLEY, JARROD | D | SPRUCE GROVE | AJHL | ||||
| NR | 214 | CHARLEBOIS, MATHIEU | D | VICTORIAVILLE | QMJHL | ||||
| NR | 215 | MENDEL, GRIFFIN | D | PENTICTON | BCHL | ||||
| NR | 216 | CAMERON, JACK | D | LAWRENCE | USHS | ||||
| NR | 217 | BERKOPEC, JOEY | D | MERRITT | BCHL | ||||
| 80 | NR | PASTUJOV, MICHAEL | RW | USNTDP | NTDP | ||||
| 130 | NR | PODDUBNYI, GERMAN | C | ERIE | OHL | ||||
| 131 | NR | HUFF, SAM | RW | WATERLOO | USHL | ||||
| 153 | NR | KREBS, DAKOTA | D | CALGARY | WHL | ||||
| 158 | NR | PEHRSON, KEATON | D | TRI-CITY | USHL | ||||
| 166 | NR | TYANULIN, ARTUR | RW | OTTAWA | OHL | ||||
| 183 | NR | SOLOW, ZACH | RW | DUBUQUE | USHL | ||||
| 192 | NR | KELLY, PARKER | C | PRINCE ALBERT | WHL | ||||
| 195 | NR | GUAY, NICOLAS | C | DRUMMONDVILLE | QMJHL | ||||
| 196 | NR | DZHIOSHVILI, VLADISLAV | RW | BLOOMINGTON | USHL | ||||
| 203 | NR | JOSLING, SEAN | RW | SARNIA | OHL | ||||
| 206 | NR | BRAZEAU, JUSTIN | RW | NORTH BAY | OHL | ||||
| 207 | NR | MARTEL, JORDAN | RW | BAIE-COMEAU | QMJHL | ||||
| 209 | NR | MACLEAN, KYLE | LW | OSHAWA | OHL | ||||
| 211 | NR | MAKINEN, OTTO | C | Salut St. Marie | OHL | ||||
| 216 | NR | DOBAY, JAYSON | D | THAYER ACADEMY | USHS | ||||
| 217 | NR | BRICKEY, RONALD | D | DES MOINES | USHL | ||||
| HUTSKO, LOGAN | RW | BOSTON COLLEGE | NCAA |